Features

Labels
AJAX(112) App Studio(9) Apple(1) Application Builder(245) Application Factory(207) ASP.NET(95) ASP.NET 3.5(45) ASP.NET Code Generator(72) ASP.NET Membership(28) Azure(18) Barcode(2) Barcodes(3) BLOB(18) Business Rules(1) Business Rules/Logic(140) BYOD(13) Caching(2) Calendar(5) Charts(29) Cloud(14) Cloud On Time(2) Cloud On Time for Windows 7(2) Code Generator(54) Collaboration(11) command line(1) Conflict Detection(1) Content Management System(12) COT Tools for Excel(26) CRUD(1) Custom Actions(1) Data Aquarium Framework(122) Data Sheet(9) Data Sources(22) Database Lookups(50) Deployment(22) Designer(178) Device(1) DotNetNuke(12) EASE(20) Email(6) Features(101) Firebird(1) Form Builder(14) Globalization and Localization(6) How To(1) Hypermedia(2) Inline Editing(1) Installation(5) JavaScript(20) Kiosk(1) Low Code(3) Mac(1) Many-To-Many(4) Maps(6) Master/Detail(36) Microservices(4) Mobile(63) Mode Builder(3) Model Builder(3) MySQL(10) Native Apps(5) News(18) OAuth(9) OAuth Scopes(1) OAuth2(13) Offline(20) Offline Apps(4) Offline Sync(5) Oracle(11) PKCE(2) Postgre SQL(1) PostgreSQL(2) PWA(2) QR codes(2) Rapid Application Development(5) Reading Pane(2) Release Notes(184) Reports(48) REST(29) RESTful(29) RESTful Workshop(15) RFID tags(1) SaaS(7) Security(81) SharePoint(12) SPA(6) SQL Anywhere(3) SQL Server(26) SSO(1) Stored Procedure(4) Teamwork(15) Tips and Tricks(87) Tools for Excel(3) Touch UI(93) Transactions(5) Tutorials(183) Universal Windows Platform(3) User Interface(338) Video Tutorial(37) Web 2.0(100) Web App Generator(101) Web Application Generator(607) Web Form Builder(40) Web.Config(9) Workflow(28)
Archive
Blog
Features
Tuesday, March 3, 2015PrintSubscribe
Introduction to Charts

Every Code On Time web app comes with multiple ways of displaying your data. One way to visualize your data is with charts. See an example of charts on the Orders page of Northwind sample below.

Default data insight charts displayed for orders page of a Northwind sample app.

When a user activates the Charts presentation style, any developer-defined charts will be displayed. If none have been defined, then the application will automatically construct charts based on the data fields present in that view.

Activating Charts Presentation

Charts can be activated by clicking on the “Charts” presentation style option in the sidebar on the left hand side of the screen.

Selecting the Charts data presentation style from the sidebar.

If the device you are using is narrow or the sidebar has been disabled, you can click on the context menu button “…” in the top right corner of the screen to bring up the context menu.

Selecting the three dot context menu button in the top right corner of the screen.

Then, click on the name of the view to bring up view options.

Activating the view settings by clicking on the view name from the context menu.

Select the “Charts” data presentation style, and the view will refresh and display charts to the user.

Selecting the charts data presentation style from the view options menu.

Responsive Design

Charts offer a responsive design that will scale to fit any device, regardless of the device’s screen size. You can get a comprehensive snapshot of your data from your phone, tablet, or desktop computer. The largest screen sizes will display three columns of charts.

The largest screens and devices will show three columns of charts.

If the window is shrunk to a moderate size or the device is a tablet, two columns of charts will be shown instead.

Only two columns of charts will be shown when the device is of medium size.

Smaller devices will display one chart at a time.

Smaller devices show one chart at a a time.

If the device or window has a short height (or if your phone is rotated horizontally), then the charts will be shrunk vertically in order to fit at least one chart at a time on the screen.

Charts will shrink vertically to fit the screen size.

Sizing Charts

Charts can also be individually resized. Each chart is set to “Small” by default. This will render three columns on large screens, two columns on medium screens, and one column on small screens. If only one chart is present for the view, then that chart will always be maximum size available for the device.

The user can change the size of each chart by clicking on the three dot context menu “…” in the top right corner of the chart. Large devices will have access to “Small”, “Medium” and “Large” sizes.

User can define the size for the chart from the context menu

Select “Large” to display a chart at full width and height of the screen. “Large” charts will scale down to “Medium” size on moderately sized devices, and to “Small” if the device cannot fit medium charts.

Large charts take the full height and width of the screen.

“Medium” chart size uses two thirds of the width and height a large screen, leaving space for one small chart in each dimension.

Medium size charts will take 2/3s of the height and width of the screen.

Medium charts on a medium size device will take the full width and two thirds of the height, leaving room for one chart above or below.

Medium size charts on a medium size device will take the full width and 2/3s of the height.

Default chart sizes can also be specified by the developer at design time.

Filtering with Charts

Any filters applied to the data view will be used by the charts. Quick filter options are available for the relevant fields in the context menu of each chart.

Quick filtering options are available based on the fields that are present in the chart.

Clicking on the name of a field will open the filter panel for that field.

The filter panel for Customer Company Name has been opened.

Select several options from the panel and press “Apply” to filter. The charts will refresh with the new, filtered data.

An Orders chart that is filtered by the customer.

Child data views also derive the filter from the selected master record. The screen below shows charts giving insight to the orders from the customer “Save-a-lot Market” – Davolio seems to be the preferred employee.

Charts for orders that are specific to a customer that has been selected as the master record.

Viewing the Data Behind the Chart

Users also have the option to view the pivoted data that the chart is based on in a table. Click on the three dot context menu “…” in the top right corner of a chart. Select “Show Data” option.

The 'Show Data' option in the context menu of a chart.

The chart will be replaced by a table that shows the data. A miniature chart preview will be shown in the top left corner.

The data for the chart is displayed in a table.

Clicking on the mini chart in the top left hand corner will restore the chart. The user can also use the “Show Chart” option in the context menu.

The 'Show Chart' option will restore the chart.

Saturday, January 24, 2015PrintSubscribe
Charts Everywhere

Every IT project involves collection of data. Development teams put a lot of thought into database design, middleware programming, business rules. Analysis of data is always somewhere a few milestones away on the project timeline. Sure the charts can make your app look good, but one needs data to feed the charts. Therefore the data analysis and charts will only become a feature of a project if it survives the initial developments stages.

Users Love Charts

Why do users love charts? The charts can tell the story that the raw data cannot.

For example, a typical list of orders hides a treasure trove of information that can be unlocked if data is pivoted, sorted, counted, and summed.  Consider the collection of charts in the screenshot below.
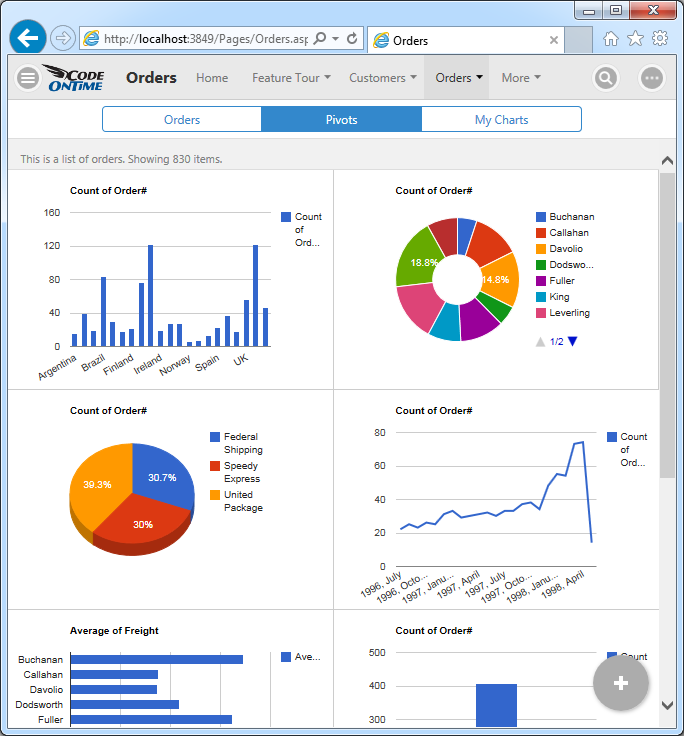
Charts view style in a Touch UI app created with Code On Time app generator.

These charts are derived from the orders stored in the Northwind database. The master-detail form with order data is shown next.
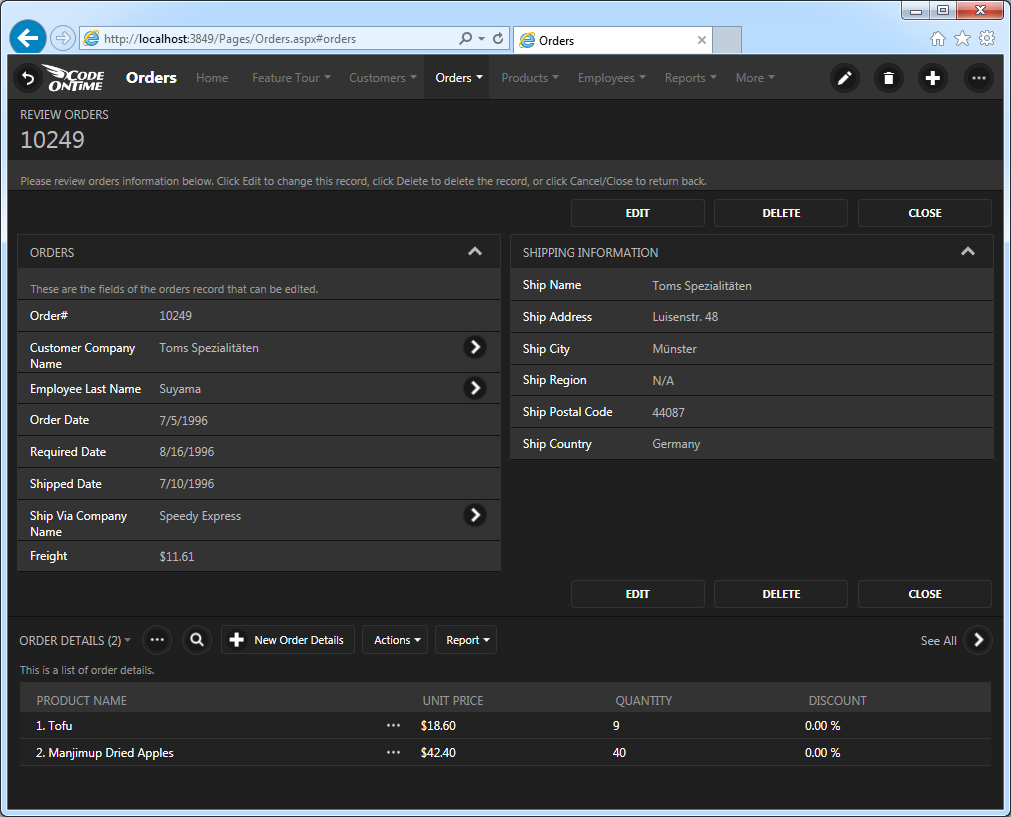
Master-detail form view in a Touch UI app created with Code On Time app generator.

Data fields Order Date, Employee Last Name, Ship Via Company Name, and Ship Country can truly illuminate the business processes within the Northwind mail order company.

For example, we can answer the following questions:

  • Which countries are the main contributors to the sales?
  • Which employee is the most productive?
  • How much are shippers utilized to fulfill orders?
  • Are sales getting better over time?
  • Which employee is contributing the most to the expense of fulfilling orders?
  • How do sales compare year over year?
  • Which month can be expected to be the busiest?

The charts in the screenshot answer the questions.
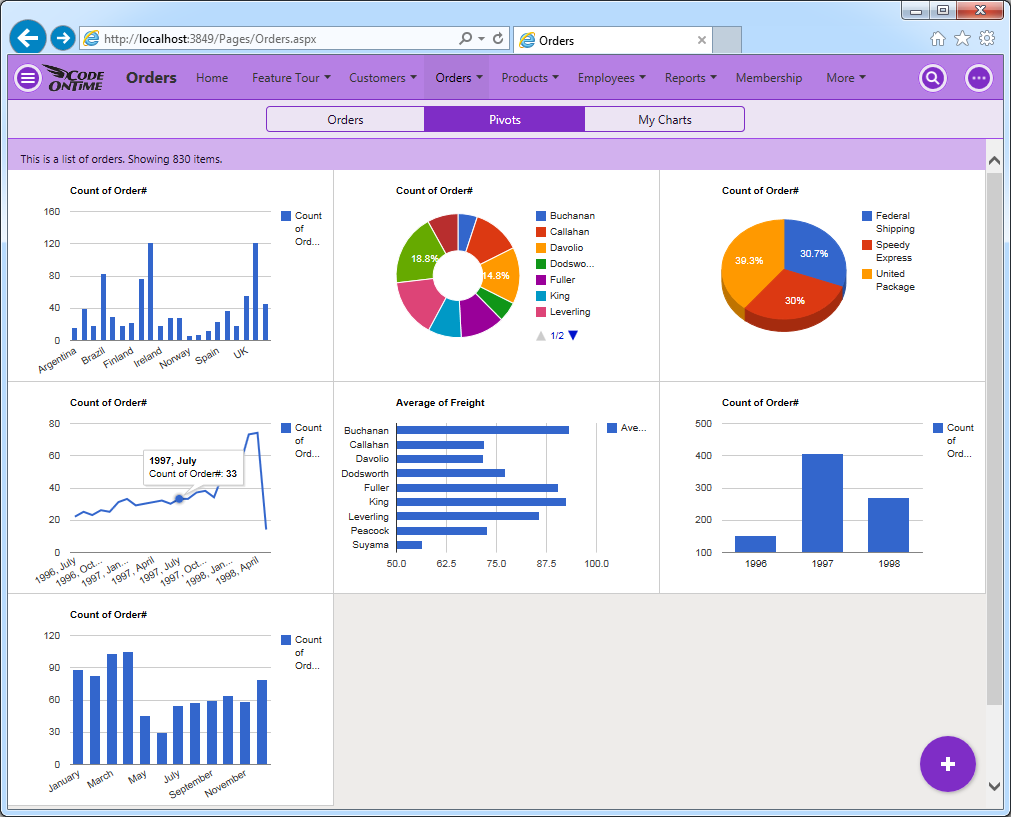
Charts in the app with Touch UI created with Code On Time.

Charts Are Created Automatically

Application framework has a built-in ability to recognize what data can be analyzed. “Lookup” and “date” fields are tagged to produce various charts without any need for programming.

If the compatible fields are detected than the “Charts” view style becomes available to end users. Charts are literally everywhere!
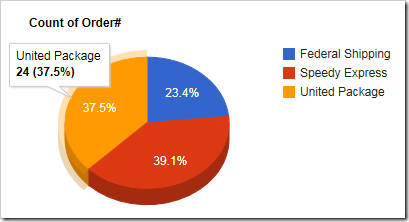
Sample chart displayed in the user interface of an app with Touch UI.

Developers can tag the fields for charting by default.  A typical “chart” tag in a data controller XML file will cause the chart above to become available when “Charts” view style is activated.

<dataField fieldName="ShipVia" aliasFieldName="ShipViaCompanyName" 
tag="pivot1-row-pie3d"/>

The server-side code of application will pivot the data and package it in the fashion suitable for chart presentation. Application produces multiple pivots while reading the same set of records from the database.  A single request to the server will retrieve all pivots for the charts displayed when “Charts” view style is activated.

The built-in ability to pivot data can be utilized to create custom charts and data presenters.

Responsive Presentation of Charts

Charts are responsive. Users will be able to interact with charts on any device. The small form factor will cause a simple list of charts to be displayed. The height of the charts is computed based on the available width and the height of the display.
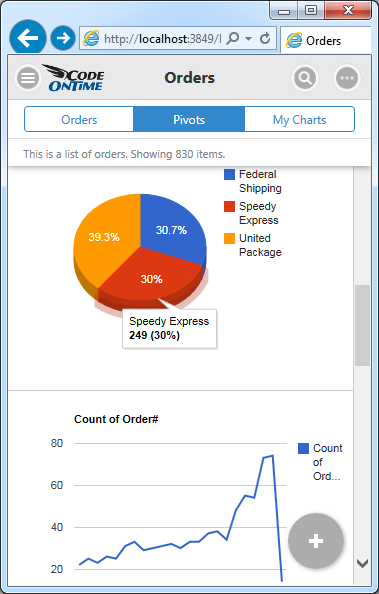
Responsive charts are displayed in a window with small form factor in a Touch UI app.

Application will try to fit as many charts as possible on screen without requiring user to scroll horizontally to see the entire set of charts.
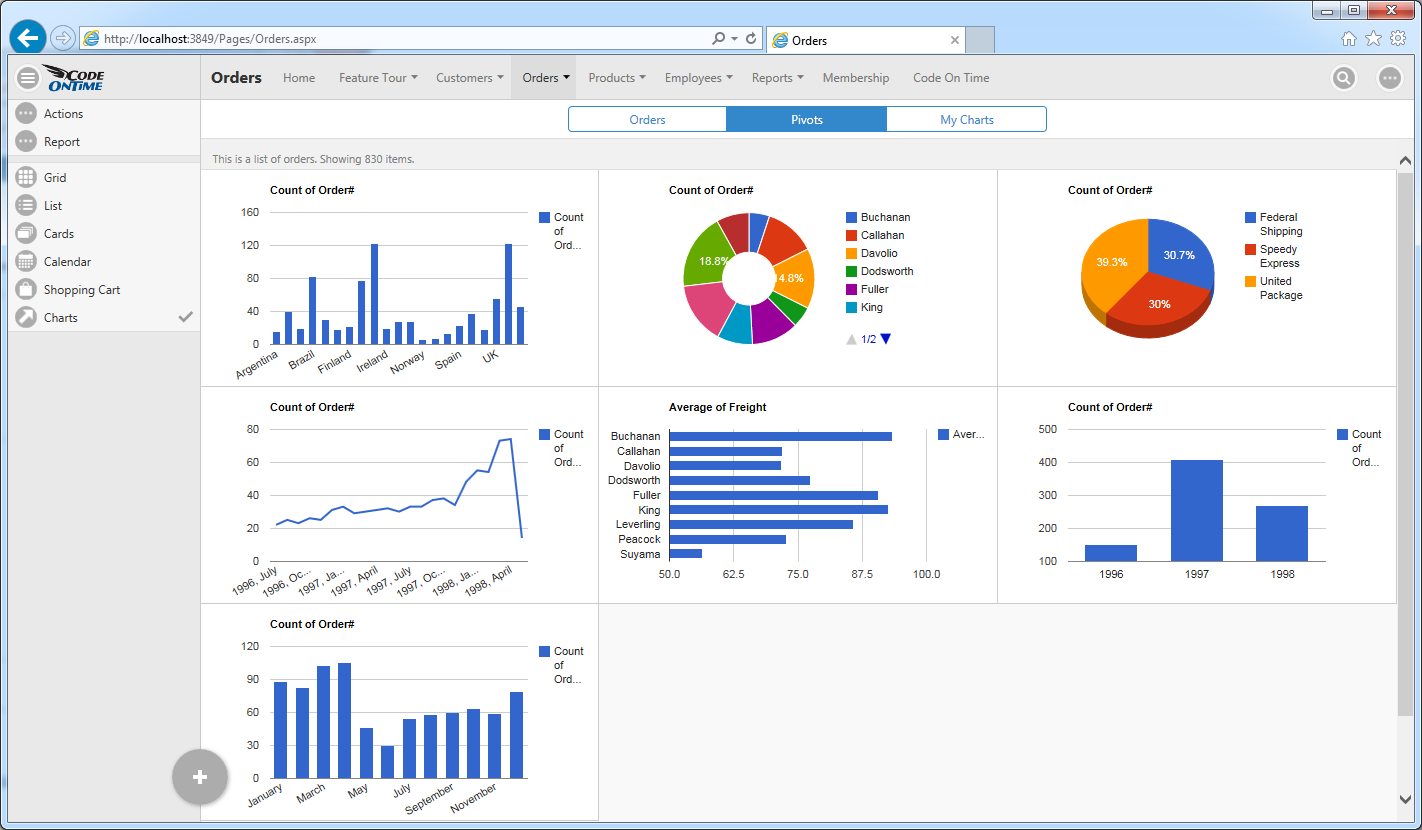
Wide displays will allow Touch UI to render multiple charts without the need for scrolling.

Activating “Charts” View Style

The option to activate “Charts” view style is visible on the sidebar as shown in the illustration above. The sidebar may not be visible on all screen sizes.

Context menu provides “Charts” option in the list of data presentation styles. A single touch or click will show the available charts.
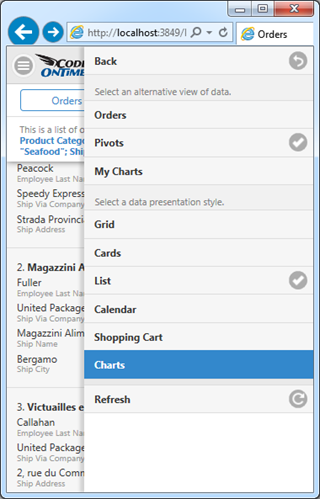
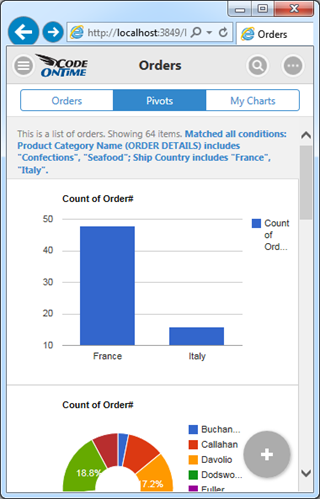
Context menu includes an option to activate Charts view style in an app with Touch UI.   Charts view style in an app with Touch UI created with Code On Time app generator.

Shaping The data In The Charts

Users shape the data set rendered in the “Charts” style with the help of Quick Find, Adaptive Filters, and Advanced Search.

For example, a user can specify a criteria for “deep search” that requires data to match the ship country to France and Italy and have associated line items with products in categories that include “Confections” and “Seafood”.
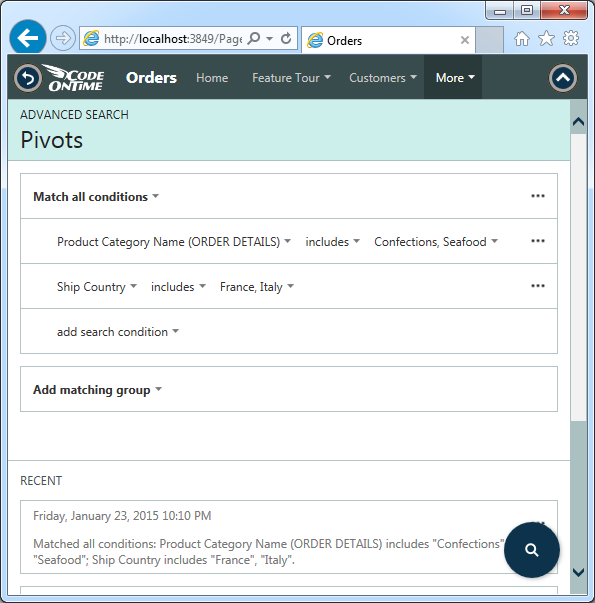
Advanced Search screen in an app with Touch UI.

Here is the result set rendered in the “List” style. User can access “Charts” view style by touching or clicking the context menu button on the right side of the toolbar.
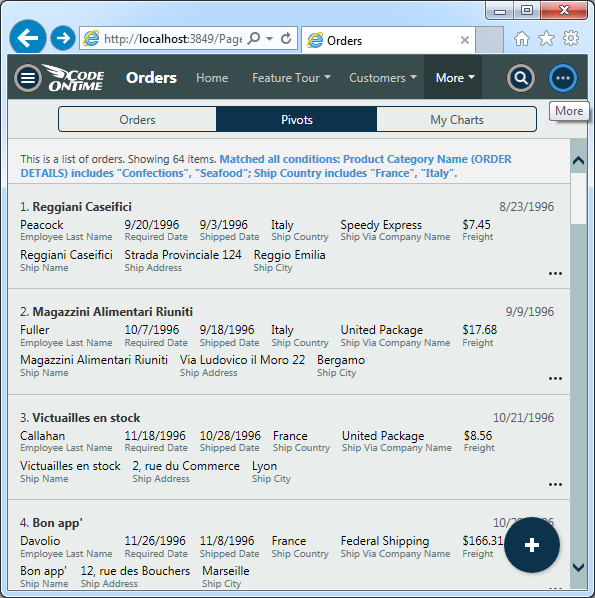
Activating context menu in a Touch UI application.

Here is the set of charts reflecting the “deep search” criteria that required searching in orders and related order details.
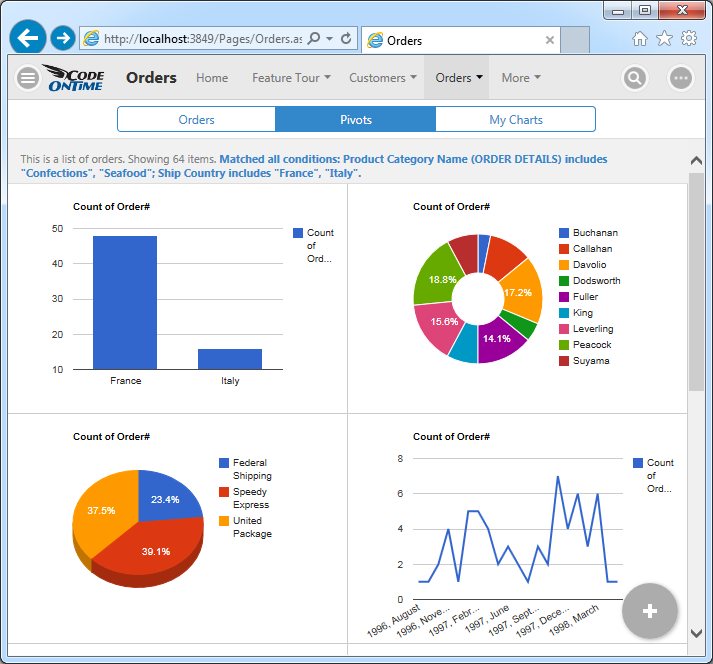
Charts view style shows data produced by deep search of orders and linked order details in Touch UI application.

This screenshot shows charts for orders shipped to Canada, USA, and UK and placed by employees Buchanan and Fuller.
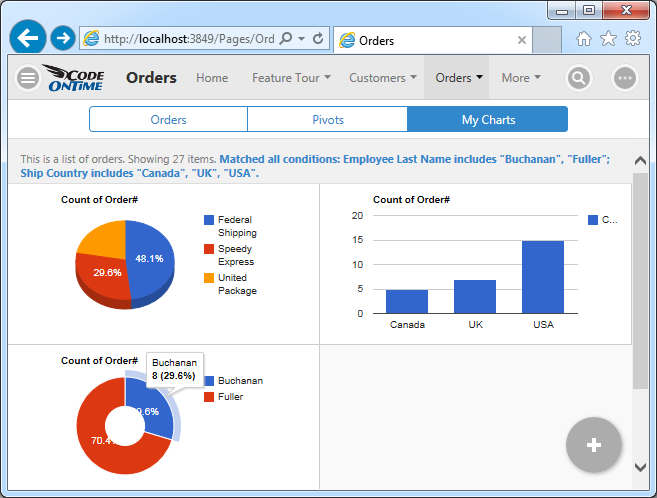
Compact set of charts rendered in Charts view style in an app with Touch UI.

User may activate responsive grid view style to see the data behind the charts.
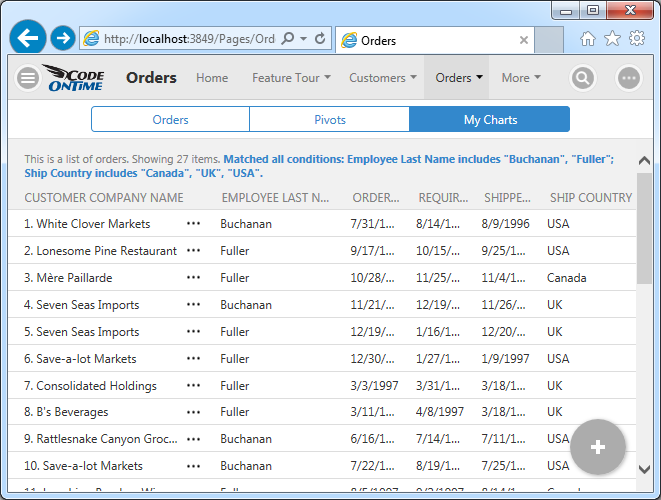
Responsive grid view style in a Touch UI app created with Code On Time.

Wider window will show charts distributed in three columns.
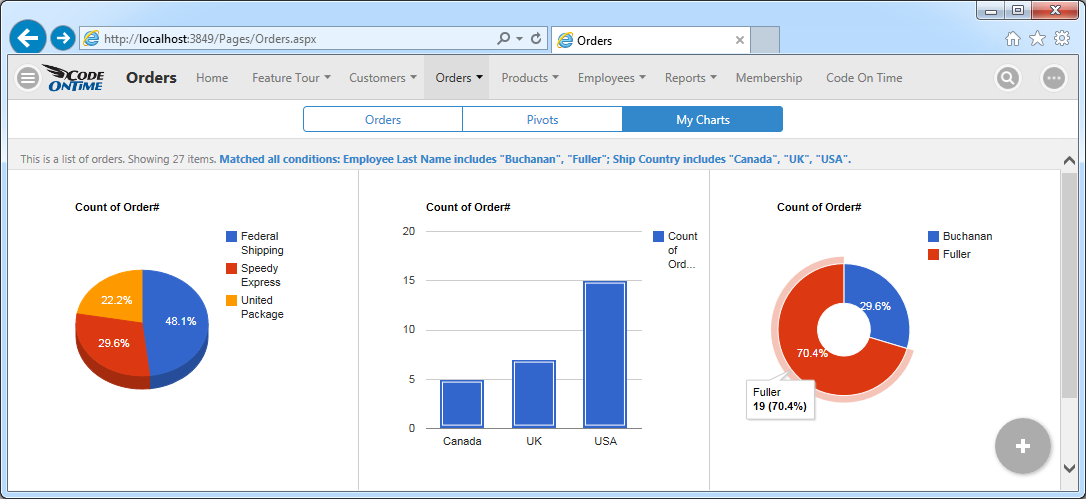
Responsive Charts view style displayed three charts side-by-side in an app with Touch UI.

Saturday, August 16, 2014PrintSubscribe
Reports at Attachments in Email Business Rules

Application framework allows generating reports on the server. This capability makes it possible to produce reports as attachments of email business rules.

Consider the following Email Business Rules implementing a simple notification executed in response to Update command in Categories data controller.

Property Value
Command Name Update
Type Email
Phase After
Script
Host: smtp.gmail.com
Port: 587
UserName: YOUR_EMAIL_ADDRESS@gmail.com
Password: PASSWORD
EnableSSL: true

From: "Sales Admin" <YOUR_EMAIL_ADDRESS@gmail.com>
To: RECIPIENT@northwind.com
Subject: Category "{CategoryName}" has changed!

Dear Admin,

This product category has been changed.
See attachment for category product details.

System Monitor

<attachment type="report">
    <name>{CategoryName}</name>
    <controller>Categories</controller>
    <view>editForm1</view>
    <filter>
        <item>
            <field>CategoryID</field>
            <operator>=</operator>
            <value>{CategoryID}</value>
        </item>
    </filter>
</attachment>
<attachment type="report">
    <name>{CategoryName} Products</name>
    <controller>Products</controller>
    <sortExpression>UnitPrice desc</sortExpression>
    <filter>
        <item>
            <field>CategoryID</field>
            <operator>=</operator>
            <value type="Int32">{CategoryID}</value>
        </item>
    </filter>
</attachment>

Note the two attachment elements embedded directly in the email message. Each element defines a snippet of XML markup describing the report execution arguments.

The first attachment is produced for Categories data controller. Data is filtered by CategoryID of the modified record. The report is produced for editForm1 view.

The second attachment is produced for Products data controller. Data is filtered by CategoryID and sorted in descending order of Unit Price. The report is produced for grid1 view.

Note the field names of the updated data record referenced in curly braces. Expressions {CategoryName} and {CategoryID} are replaced with the actual values during processing.

Attachment definitions are removed from the email body by application framework. The framework will generate each report using specified arguments and attach the report to the email before it is sent out to the recipient.

Run the application and edit any category. Click OK button to save the changes.

An email business rule will trigger an email notification with two report attachments produced in a Touch UI app created with Code On Time application generator.

The data will be saved after a slight delay.

Check your smart phone device for messages.

An email notification on an Android device generated by an Email Business Rule of an app produced with Code On Time.

This is how the email message may look.

The text of the email notification produced by an Email Business Rule in an app created with Code On Time applicaition generator.

Click on an attachment to see the report data in a PDF reader installed on your device.

An attachment report with Category details displayed in Adobe Reader on an Android device.

An attachment report with a list of Products in changed category displayed in Adobe Reader on an Android device.