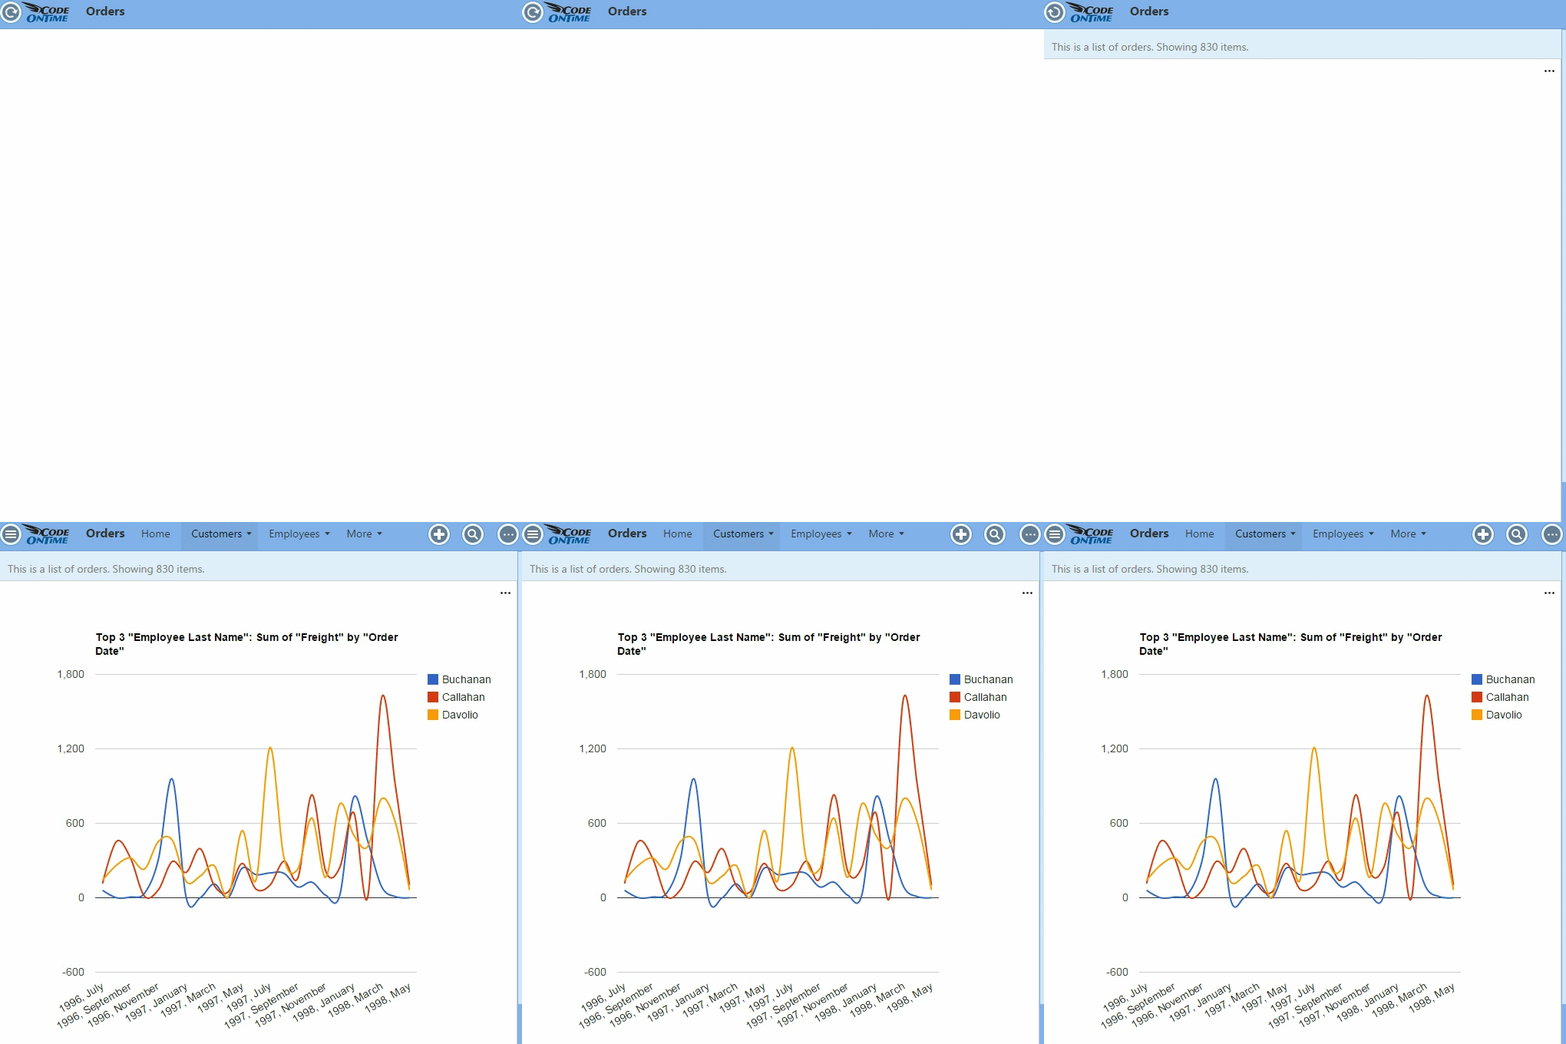
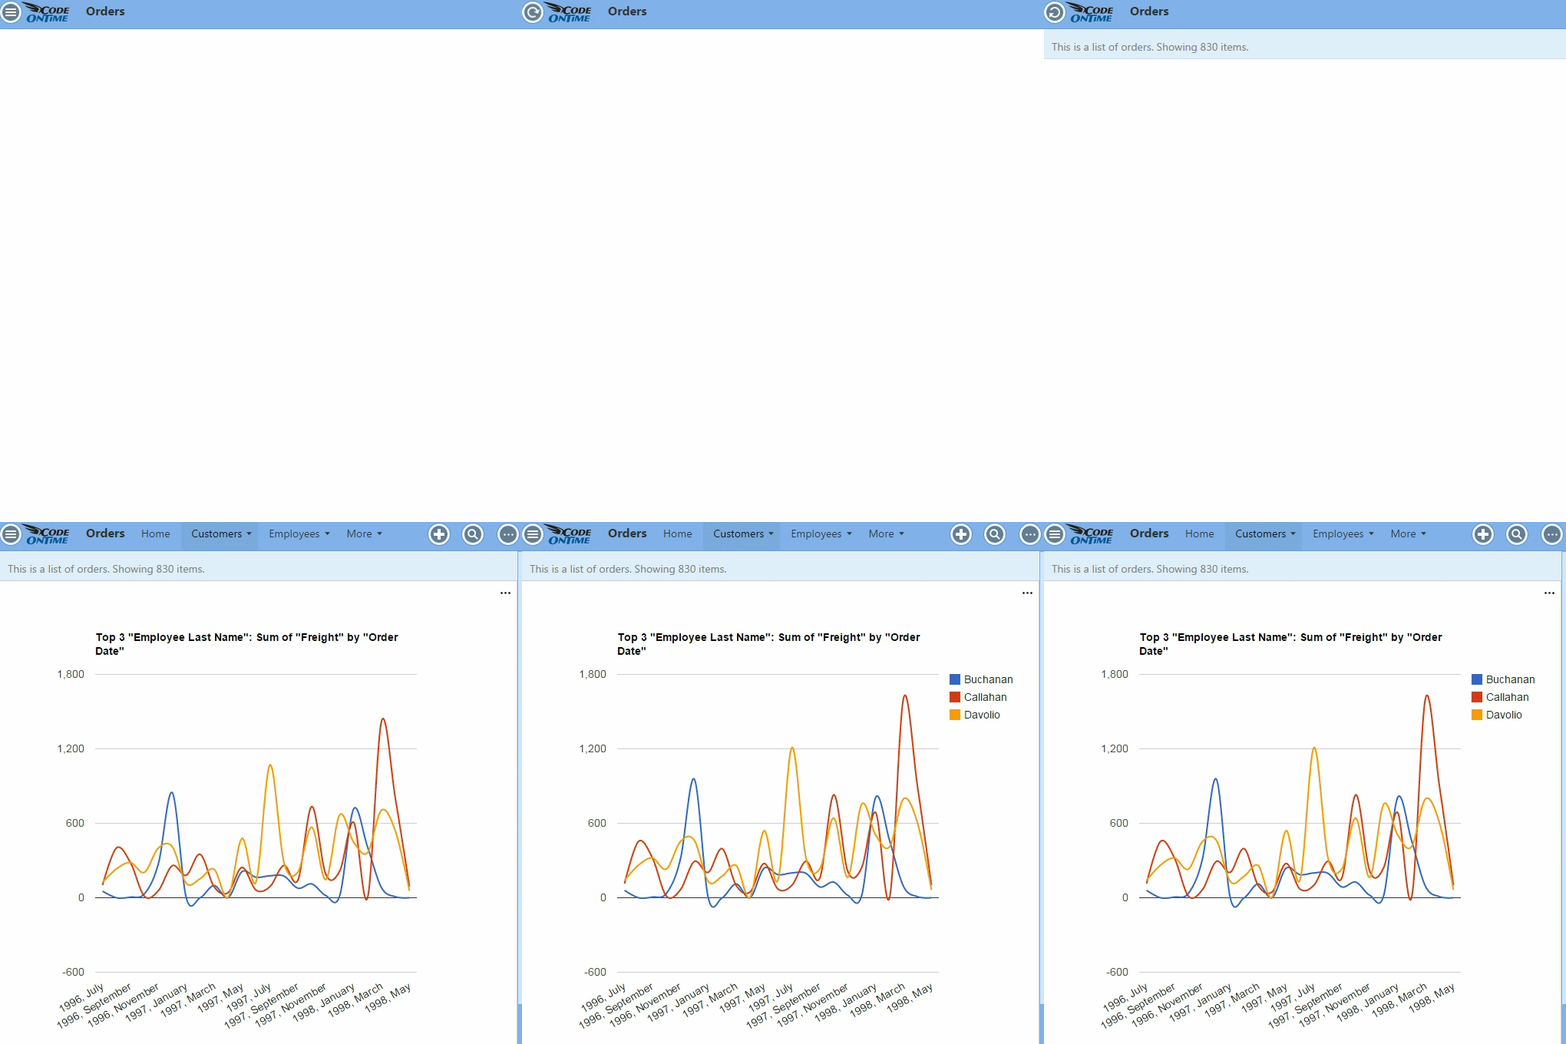
Charts in web apps created with Code On Time generator do not show any animations by default. The charts simply appear.

It may be desirable to add an animation when the chart is loaded. This animation can be added by specifying the “animation” keyword to the chart tag definition.
| Data Field | Tag |
| EmployeeID | pivot1-col1-top3 pivot1-animation |
| OrderDate | pivot1-row1-line-curve-date |
| Freight | pivot1-val1-sum |
The new chart will now be animated on load.
