Ability to see multiple views of the same data is an invaluable tool for the end users of your applications. It provides increased productive due the reduced time spent while searching for data.
Let's generate a Data Aquarium Framework application from the Northwind database and research the multiple view presentation capabilities of the framework. If you run the application and select Customers option from the drop down at top of the page then the following view of customers is displayed.
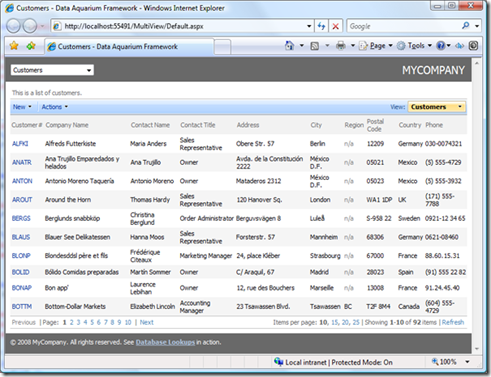
At the right side of the blue tool bar above the grid you can see the orange view selector that shows Customers in it. You can expand the list of views to provide alternative presentation of data without any coding.
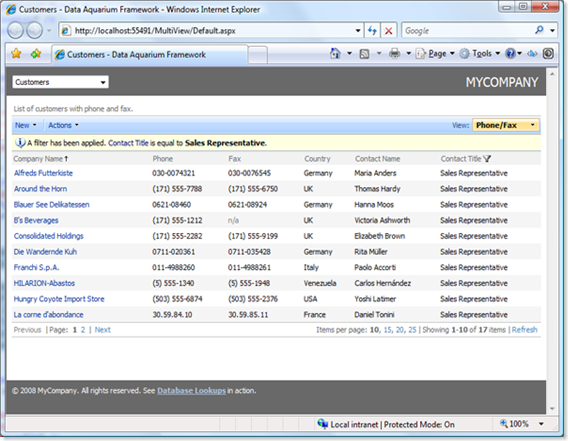
Suppose you want to display phone and fax information on screen and don't really care if the customer ID is available. Open the ~/Controllers/Customers.xml data controller descriptor file in Visual Studio 2008 and add the following markup in the views section:
    <view id="grid2" type="Grid" commandId="command1" label="Phone/Fax">
      <headerText>List of customers with phone and fax. </headerText>
      <dataFields>
        <dataField fieldName="CompanyName" columns="40" />
        <dataField fieldName="Phone" columns="24" />
        <dataField fieldName="Fax" columns="24" />
        <dataField fieldName="Country" columns="15" />
        <dataField fieldName="ContactName" columns="30" />
        <dataField fieldName="ContactTitle" columns="30" />
      </dataFields>
    </view>
This is how the data will be presented if you refresh the page and select the name of the new view in the view selector. Notice that each view maintains its own sorting, adaptive filtering, and current page when you switch from one view to another.
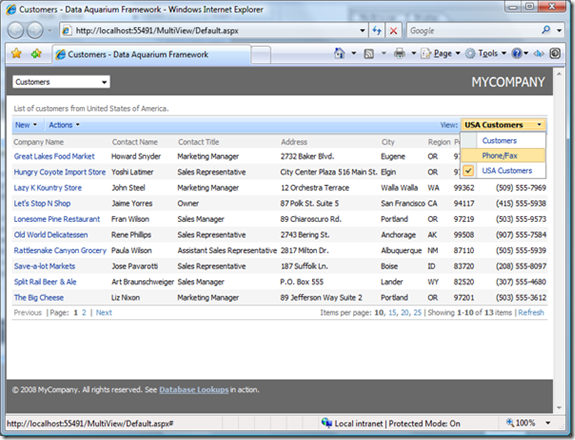
You may also provide an alternative query to produce data displayed in the view. Imagine that you want to have a quick way to list all customers from United States of America. You will need to define the following command in commands section of the data controller:
    <command id="command2" type="Text">
      <text>
        <![CDATA[
select
    "Customers"."CustomerID" "CustomerID"
    ,"Customers"."CompanyName" "CompanyName"
    ,"Customers"."ContactName" "ContactName"
    ,"Customers"."ContactTitle" "ContactTitle"
    ,"Customers"."Address" "Address"
    ,"Customers"."City" "City"
    ,"Customers"."Region" "Region"
    ,"Customers"."PostalCode" "PostalCode"
    ,"Customers"."Country" "Country"
    ,"Customers"."Phone" "Phone"
    ,"Customers"."Fax" "Fax"
from "dbo"."Customers" "Customers"
where
  "Customers"."Country"='USA'
]]>
      </text>
    </command>
Also add the following view in the views section:
    <view id="grid3" type="Grid" commandId="command2" label="USA Customers">
      <headerText>List of customers from United States of America. </headerText>
      <dataFields>
        <dataField fieldName="CompanyName" columns="40" />
        <dataField fieldName="ContactName" columns="30" />
        <dataField fieldName="ContactTitle" columns="30" />
        <dataField fieldName="Address" />
        <dataField fieldName="City" columns="15" />
        <dataField fieldName="Region" columns="15" />
        <dataField fieldName="PostalCode" columns="10" />
        <dataField fieldName="Phone" columns="24" />
      </dataFields>
    </view>
View grid3 is referring to command2 in the commandId attribute of the view element.
The following presentation will be available to application users from now on. Independent sorting, paging, and current page are automatically maintained for this view as well.
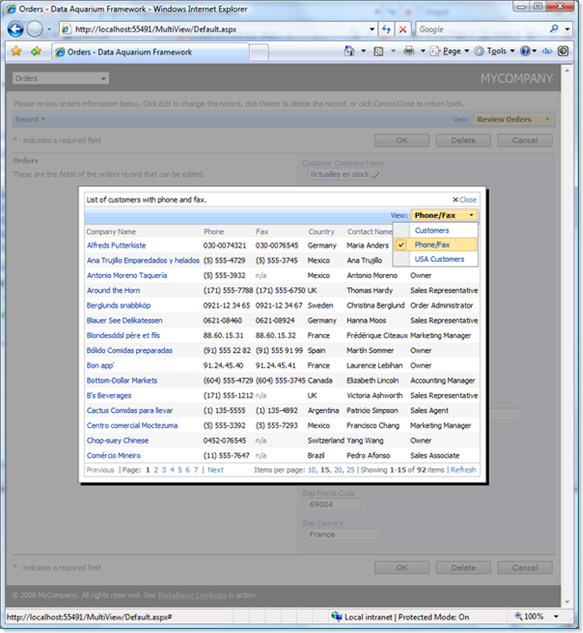
Notice that all views are instantly available in any data lookups that are referring to Customers data controller. Verify that by navigating to the orders screen. Select any order and edit the record. Click on the Customer Company Name link and try selecting the views that we have defined.
Data Aquarium Framework provides unparalleled ease and flexibility in defining custom presentation views of your data.